DIVE INTO SPOTIFY WITH PYTHON
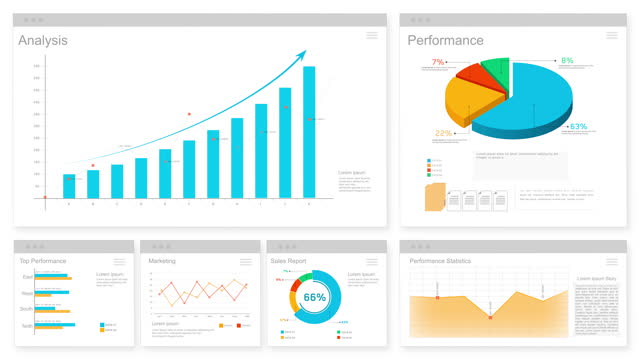
Unleashed Python's power to unearth insights from Spotify's data, delivering compelling analyses and visualizations that illuminated music trends and listener preferences.

An analytical mind with expertise spanning Excel, Power BI, SQL, Tableau, and Python @kikitheanalyst
Unleashed Python's power to unearth insights from Spotify's data, delivering compelling analyses and visualizations that illuminated music trends and listener preferences.
Through rigorous Excel data cleaning, transformed Ferrari's 2023 sales records into an analysis-ready state. Crafted insightful visualizations and dashboards, spotlighting key performance metrics and geographic sales patterns, delivering actionable insights to optimize sales strategies.
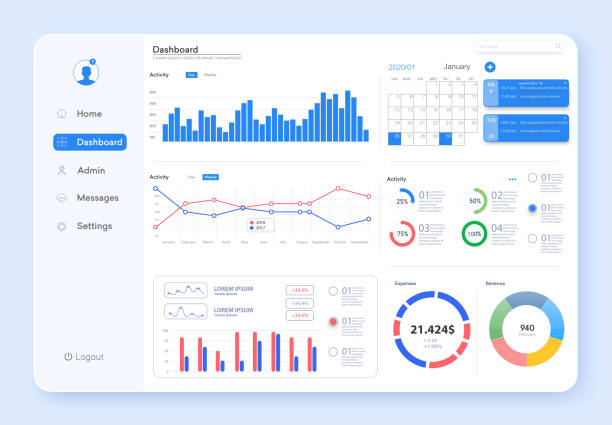
Develop an interactive Power BI dashboard that analyzes sales data for a retail store (or a dataset you have access to). Allow users to explore sales trends by product category, customer demographics, and promotional effectiveness. Include features like drill-down capabilities, interactive filters, and conditional formatting.

Design and implement an SQL database in a relational database system. Use SQL queries to retrieve specific information, generate reports, and explore relationships between different data points.
Create a customizable Excel template that calculates key financial ratios (e.g., profitability ratios, liquidity ratios) based on user-provided financial data. Automate calculations using Excel formulas and functions. Present the results in a professional and well-formatted manner.
Lekki, Lagos
%20Screenshot%20-.jpg)